


 Web Trader MT5












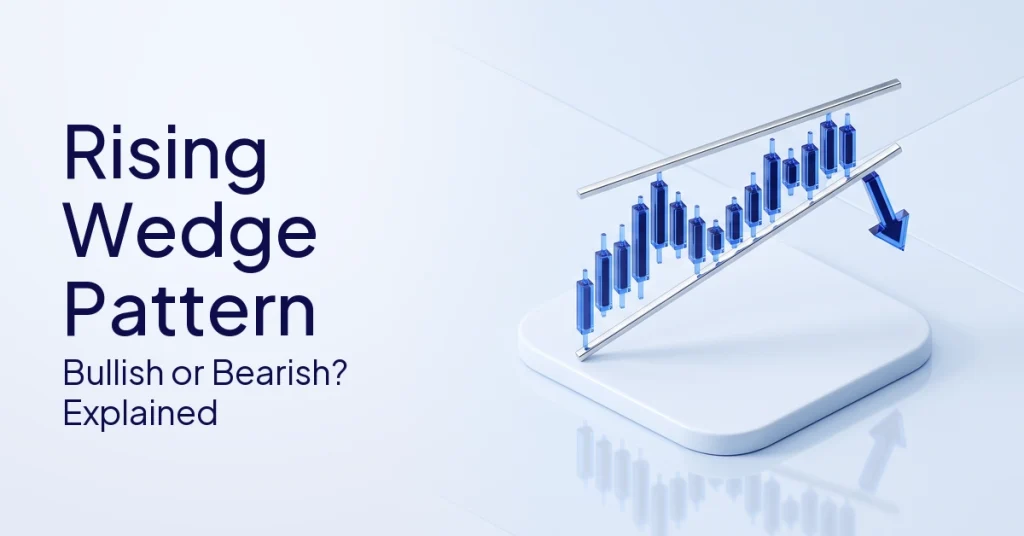
The rising wedge pattern is generally seen as a bearish signal, although it is an upward-sloping pattern. Have you ever wondered how a chart formation that appears to be moving higher on the surface could actually be interpreted as a possible sign of a price decline?
In this particular formation, we have two trendlines sloping upwards and joining as the trading range is currently undergoing tightening. Its classic interpretation is very much dependent upon the market environment in which it appears and should never be treated as a sure-fire reversal or directional signal.
A common misconception among beginners is that the word “rising” determines the expected direction of price after the setup forms. In fact, “rising” is merely a geometric way to describe the direction of the wedge’s boundaries. This distinction is the first step in objectively reading price charts.
Quick Answer
A rising wedge pattern is traditionally interpreted as bearish even when it slopes upward. It’s made up of two upward-sloping trendlines that are converging, which suggests the price range is narrowing and may indicate weakening upward momentum. It appears in an uptrend, where it may be interpreted as a potential bearish reversal pattern, or in a downtrend, where it may be interpreted as a continuation of the decline. Note that this pattern is an observational pattern and not a sure-fire prediction.
Is a rising wedge pattern bullish or bearish?
Though the slope is upward, this formation is often viewed as a bearish reversal or a continuation of the decline signal, depending on the circumstances. Traditionally, upward-sloping formations are associated with bearish price behavior across asset classes.
A sloping-up chart does not necessarily make the pattern bullish. The trick to reading this setup correctly is to understand the broader context of bullish vs bearish market environments. Wedges are fairly easy to develop in either up or down markets.
One must appreciate the distinction between the conventional reading of a pattern and an assured market result. In the end, it is the context that determines whether analysts view the formation as a possible reversal or a continuation structure. You should avoid language or assumptions that imply that knowing this setup tells traders exactly what to do next.
Why Can An Upward-Sloping Pattern Be Bearish?
The narrowing range is often interpreted as a sign that the upward move is becoming more and more restricted. Both boundary lines can slope upward. The distance between the two boundary lines can become progressively tighter.
The tightening range shows how hard it’s getting for buyers to push prices higher as they did before. This internal compression is what gives the setup a distinctly bearish reputation, even with its overall upward direction.
What is the Rising Wedge Pattern Meaning?
This formation is characterized by two upward-sloping converging trendlines, which compress the price action into a narrower and narrower range. Taking a look at the basics of technical analysis is a good starting point to have a full understanding of this concept.
You get a feel for how the lines relate to each other and so discover the main structural properties. Both margins are increasing, but at different rates, so the top and bottom lines are coming closer together over time.
The trading range is contracting actively as the formation continues. In this development phase, the price usually fluctuates between the two boundaries. This particular pattern can play out in many different market settings and time frames.
What Are the Two Boundaries of a Rising Wedge?
The formation is bounded on top by a trend line connecting the higher highs and on the bottom by a trend line connecting the higher lows. The upper trendline connects relevant higher price points and is sloping up consistently.
The lower trendline, however, connects relevant lower price points and also has an up slope that is typically a bit steeper. The two lines come together and get closer and closer until they form the wedge shape.
To identify these boundaries, careful observation of historical price relationships is required, following the educational guidelines of the CFA Institute.
How does a rising wedge pattern in uptrend appear?
This formation usually takes place after a prolonged move higher and may be a sign that momentum is waning. In this particular case, the price is still making higher highs and higher lows within the narrowing structure.
However, as the upside action approaches the top of the wedge, it is increasingly squeezed. Technical analysts often study the pattern as a possible sign that upward momentum is becoming less decisive.
The bearish interpretation is traditionally associated with a follow-up move below the lower boundary. However, this is still pattern-based observation and not a hard prediction. It’s important to note that not every rising wedge leads to lower prices.
Can a Rising Wedge Pattern Appear in a Downtrend?
These formations may also be short-term upward corrections in larger downward trends. The wedge may be a short-lived uptrend in the midst of a much larger, overarching market decline.
The upward move inside the wedge does not necessarily mean the broader market has changed its main direction. In this context, the formation is sometimes interpreted as a bearish continuation structure instead of a reversal.
When you are looking at a chart pattern, the bigger picture is still very important. A chart movement should be analysed in the context of broader market trends and relevant market conditions to provide a more balanced and complete view of price movements.
What does a rising wedge pattern breakout look like?
Conceptually, a breakout is said to happen when the price decisively moves outside one of the boundary lines. This is a change from the tight price action that defined the setup previously.
Breakout Below the Lower Boundary
The traditional bearish read is for the price to decisively break below the lower trendline. But analysts say that is a very common pattern of development, not a certainty.
Many times, a move outside of the boundary will fail and the price will easily come back inside the formation. Observers watch these boundary interactions carefully, without jumping to conclusions about where they might be heading.
What Is the rising wedge pattern target?
Some TA techniques project a potential price objective based on the maximum height of the wedge. Analysts may measure the widest part of the setup and project that distance down from the breakout point.
It’s important to take this as only a conceptual reference point used in some chart analysis. It is never a promised result or a guaranteed destination. Price can and often does act in a completely different manner than the traditional projection of the pattern.
Can a Rising Wedge Breakout Fail?
False breakouts happen regularly, so a break below the boundary does not mean a sustained drop. A break below the lower boundary does not guarantee the broader downside interpretation will play out.
Price can turn around quickly and go back into the wedge formation. Or it can consolidate or go in a totally different direction, showing how unpredictable financial markets can be.
How Is a Rising Wedge Different From an Ascending Triangle?
Both patterns slope up. A wedge has a converging shape on either side and an ascending triangle has one flat side. When you are reading a chart accurately, it is important to know this structural difference.
| Feature | Rising Wedge | Ascending Triangle |
|---|---|---|
| Upper boundary | Rising | Generally flat |
| Lower boundary | Rising | Rising |
| Shape | Two converging upward-sloping boundaries | Flat resistance with rising support |
| Trading range | Narrows | Narrows |
| Typical interpretation | Often bearish | Often associated with bullish continuation |
| Context | Important | Important |
Make this comparison descriptive and do not imply that either pattern is a guaranteed result. If you want to learn about the alternate formation, you can read the detailed article on the ascending triangle pattern.
What Should Beginners Keep in Mind About This Pattern?
Remember, pattern recognition has limits and is heavily dependent on broader market context. Beginners must be aware of this.
- The Pattern Is Not Assured: The rising wedge is usually a bearish pattern, but the price action is often very different.
- Context Matters: Analysts consider the prior trend, the price structure surrounding it and the overall market context before reaching conclusions.
- False Breakouts Can Occur: A move through a boundary does not ensure a continued move in that direction.
- Pattern Identification Can Be Subjective: Different observers may draw the boundaries differently or disagree as to whether a price has formed a valid wedge.
You shouldn’t treat the pattern as a signal unto itself. Chart patterns are usually taught together with broader technical analysis, not as automatic instructions.
Technical analysis examines historical market data, such as price movements and trading volume, to identify potential market trends. However, past price movements do not guarantee future results. The idea of support and resistance is useful for a more balanced perspective.
The logical next step for educational purposes is to study how these formations evolve using historical charts or available STARTRADER educational resources. A live trading account is not necessary to learn these concepts.
FAQs
The word “rising” just describes the geometric direction of the two boundaries, not the momentum. The narrowing price range provides the bearish interpretation. This contraction may indicate weakening upward momentum, showing that buyers may be finding it more difficult to push prices higher.
Yes, it can form smoothly in a short upward correction in an overall downtrend. Analysts may look at a wedge differently in that context than they would at one that follows a sustained advance. It is generally seen as a continuation of the main downtrend and not a reversal.
There is no fixed training period for this setup at all. Duration can vary considerably depending on the particular market, the time period selected and the price structure in question. It can appear on a few-hour short-term chart or on a multi-month long-term chart.
Yes, basically opposite boundary slopes in the two formations. A rising wedge has upward-sloping boundaries, and a falling wedge has downward-sloping boundaries. Their traditional interpretations are vastly different, but neither of the setups guarantees a particular market outcome.
Yes, price can move outside a boundary, reverse or pull back into the formation. Hence, a breakout does not necessarily mean continuation in the expected direction. False breakouts are common and show the importance of risk management in any analysis.
Conclusion
A rising wedge is a chart pattern that has two converging trendlines, both sloping upwards and narrowing. It has an upward look but is traditionally linked with bearish behavior. But its interpretation can differ a lot depending on whether it is seen during an uptrend or a more general downtrend.
And always remember, the formation is an indication of a pattern in historical price behavior, not a guarantee of future action. Of course, false breakouts or other market conditions are always possible. Hence, the pattern should be analyzed and understood in relation to the broader market.
Risk Warning and Disclaimer
CFDs are complex instruments and come with a high risk of losing money rapidly due to leverage. You should consider whether you understand how CFDs work and whether you can afford to take the high risk of losing your money.
This content is for general educational and informational purposes only and does not constitute investment advice or a recommendation to buy or sell any financial instrument. Chart patterns, including rising wedges, are based on historical price movements and do not guarantee future market direction, breakout outcomes or price targets. Technical analysis has limitations, and market conditions can change unexpectedly. CFDs are leveraged products that carry a high risk of loss and may not be suitable for all investors. Consider your financial circumstances and risk tolerance before making any investment or trading decision.
Tags


Open Live Account
 Email Address
 Phone Number
Important Notice
STARTRADER does not accept any applications from Australian residents.
To comply with regulatory requirements, clicking the button will redirect you to the STARTRADER website operated by STARTRADER PRIME GLOBAL PTY LTD (ABN 65 156 005 668), an authorized Australian Financial Services Licence holder (AFSL no. 421210) regulated by the Australian Securities and Investments Commission.
Important Notice for Residents of the United Arab Emirates
In alignment with local regulatory requirements, individuals residing in the United Arab Emirates are requested to proceed via our dedicated regional platform at startrader.ae, which is operated by STARTRADER Global Financial Consultation & Financial Analysis L.L.C.. This entity is licensed by the UAE Capital Market Authority (CMA) under License No. 20200000241, and is authorised to introduce financial services and promote financial products in the UAE.
Please click the "Continue" button below to be redirected.


