


U.S. Dollar Index (USDX)
The dollar stuck in choppy trade on Wednesday, after its biggest surge for weeks as Fed officials talked up the potential for further aggressive interest rate hikes. On Tuesday, Fed officials Mary Daly and Charles Evans signaled that they and their colleagues remain resolute and “completely united” over getting rates up to a level that will more significantly curb economic activity.
The U.S. dollar index traded about 0.3% lower by the Asian afternoon to 106.120, amid a hint of relief that House Speaker Nancy Pelosi’s visit to Taiwan brought few surprises.
Technically:
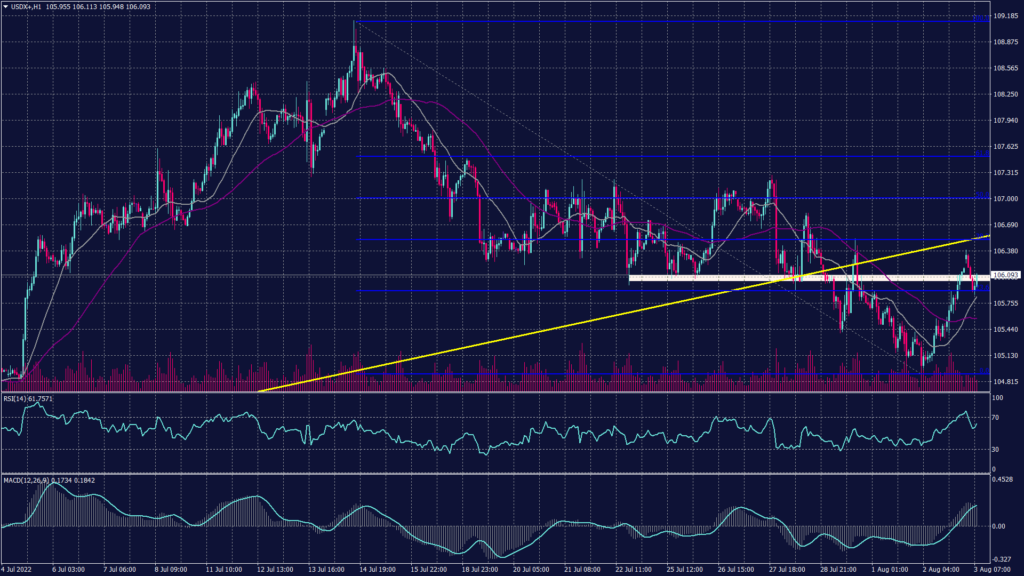
The U.S. dollar index continues the secondary downtrend after breaking below the upward channel at 106.20 on the daily chart. The hourly chart’s index remains negative despite the support at 105.40 and 104.60. Meanwhile, the daily chart shows a high possibility of continuation towards the strong support at 103.55, which will raise two scenarios.
In the first scenario, if the index bounced from 103.55 it will most likely continue the main trend upwards. In the other scenario, if the index broke below the previous bottom at 103.55 it will be confirming the change of direction.
Technical indicators show mixed signals as RSI shows fluctuations between 104.60 and 105.40 while MACD shows a continuation to the downside.
PIVOT POINT: 106.10
| SUPPORT | RESISTANCE |
| 105.90 | 106.20 |
| 105.55 | 106.50 |
| 105.10 | 107.10 |
Japanese Yen (USDJPY)
The Japanese Yen hit the strongest level since mid-June against the greenback on Monday as investors weighed the probability that the Federal Reserve will not raise interest rates as aggressively than expected. Also last week, the dollar crumbled against the yen, and two-year yields in the U.S. Treasury market also fell, after data showed the U.S. economy shrank for a second straight quarter.
Technically:
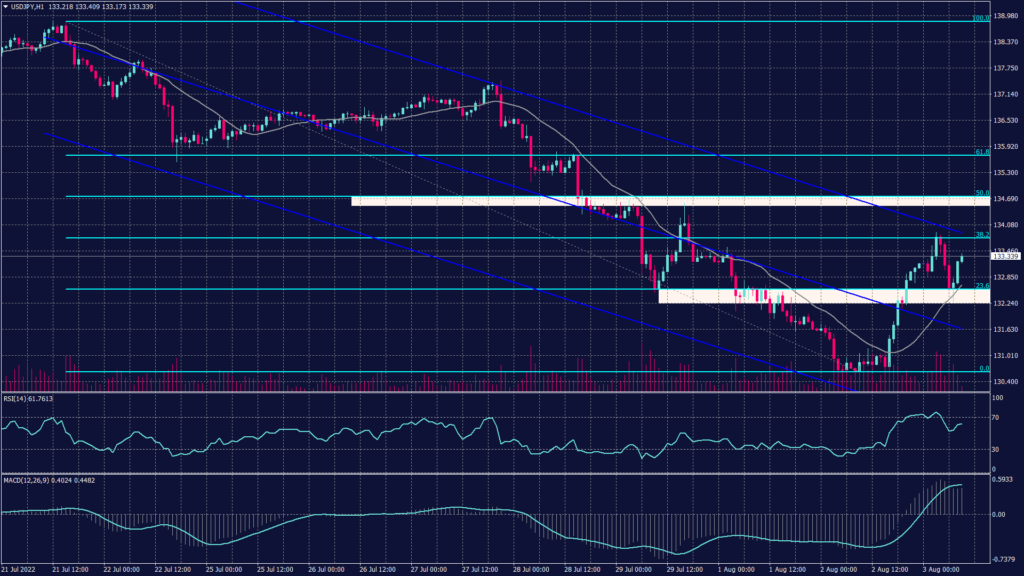
The hourly chart shows a continuation to the downtrend as the pair is committing to the regression channel shown in the chart above. Additionally, Fibonacci retracement signals support above 130 Yen per dollar. Meanwhile, the daily chart confirms the sharp continuation and signals a target at the previous support 126.of 60. Technical indicators confirm the hypothesis of continuation, and the moving averages remain diverging.
PIVOT POINT: 133.20
| SUPPORT | RESISTANCE |
| 133.55 | 131.50 |
| 129.85 | 132.10 |
| 126.60 | 132.60 |
Australian Dollar (AUDUSD)
The Australian dollar slumped on Tuesday after the central bank opened the door to a slowdown or pause in the pace of future hikes. It was last steady at $0.6930.
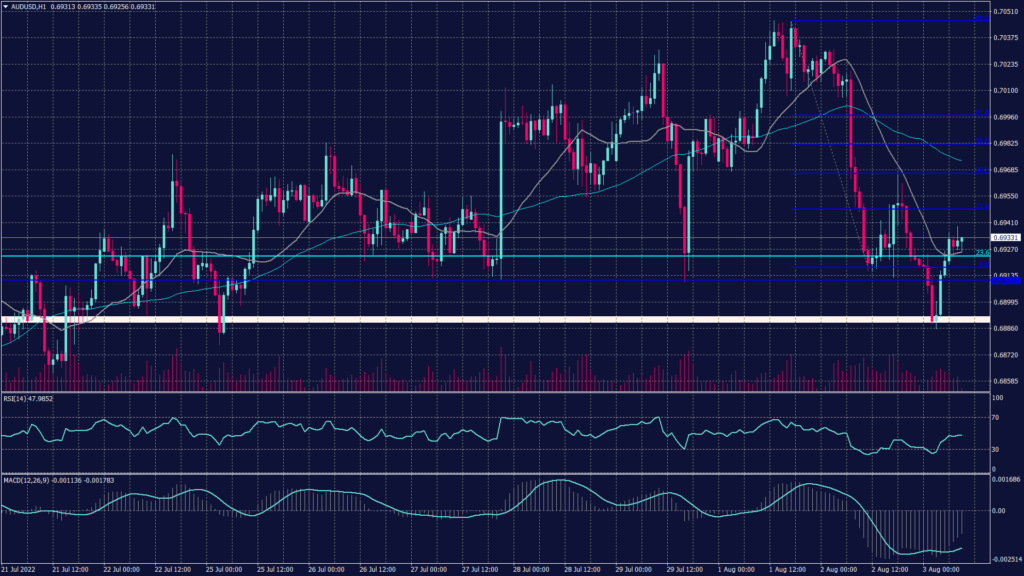
Aussie pair remains negative as signals further decline on both the daily and hourly chart. However, Fibonacci retracement shows support at 0.69260 and, price action also confirms the support range above 0.69100. Market analysts see the level of 0.6900 as a critical level of which breaking it will most likely result in drop towards 0.68750.
PIVOT POINT: 0.69100
| SUPPORT | RESISTANCE |
| 0.68990 | 0.69730 |
| 0.68800 | 0.69960 |
| 0.68700 | 0.70200 |
Spot Gold (XAUUSD)
Gold prices fell on Wednesday, with futures shedding nearly 1% after hawkish statements from several Fed officials pushed up the dollar with the possibility of sharper interest rate hikes.
Meanwhile, the yellow metal futures had briefly climbed above $1,800 yesterday as concerns over rising U.S.-China tensions compelled safe-haven demand. However, the gains were trimmed after two Fed officials outlined the possibility of more steep interest rate hikes to combat rampant inflation. Gold Futures fell 0.9% to $1,774.20 an ounce while Spot gold was down 0.2% at $1,758.12.
Technically:
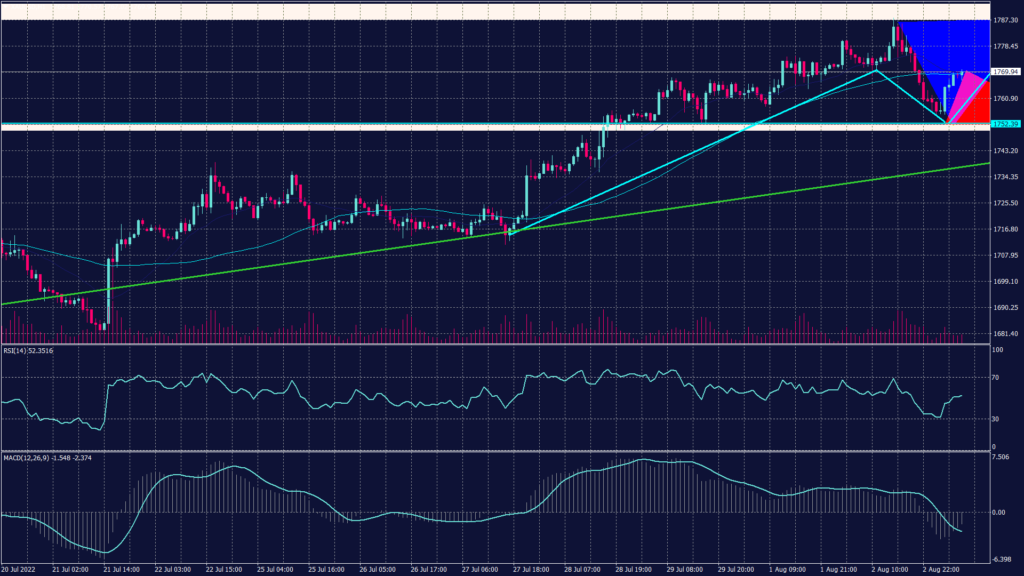
Gold daily chart remains committed to the declining channel and has been trying to break above it for the past two days. Meanwhile, the hourly chart shows high volatility and wobbling below $1,770 an ounce. Additionally, the hourly chart faces resistance at 1,779, confirmed by Fibonacci retracement readings.
PIVOT POINT: 1,764
| SUPPORT | RESISTANCE |
| 1,752 | 1,779 |
| 1,745 | 1,800 |
| 1,738 | 1,810 |
West Texas Crude (USOUSD)
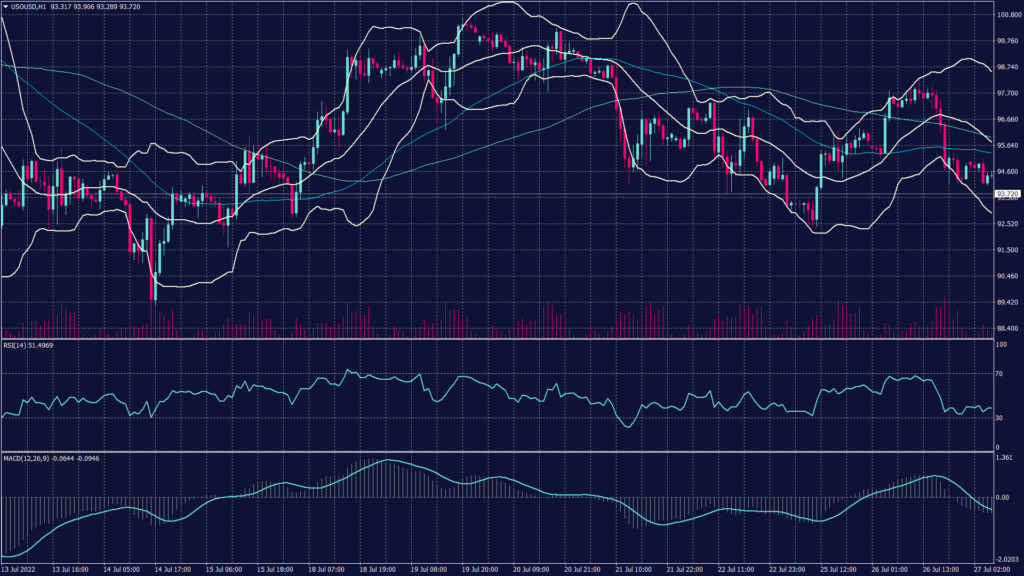
Oil prices fell about 1% in early trade on Wednesday before paring some losses, ahead of a meeting OPEC+ producers on fears of a slowdown in global growth hitting fuel demand and a firmer dollar. Brent crude futures were last down 0.4% at $100.16 a barrel, while WTI crude futures shed 0.4% to $94.07 a barrel.
Technically:
WTI chart shows a high possibility of the continuation of the downtrend but is trading at important support near $92 per barrel. Meanwhile, the hourly chart shows a fluctuation inside the range between $92 and $93.50 a barrel unless the prices penetrated above $93.90.
PIVOT POINT: 92.40
| SUPPORT | RESISTANCE |
| 92.00 | 93.50 |
| 91.20 | 95.30 |
| 89.80 | 96.30 |
العلامات
افتح حساب حقيقي
الرجاء إدخال اسم بلد صحيح
لم يتم العثور على نتائج
لم يتم العثور على نتائج
يرجى إدخال البريد الإلكتروني الصحيح
الرجاء إدخال رمز التحقق الصحيح
1. 8-16 حرفاً + أرقام (0-9) 2. مزيج من الحروف (A-Z، a-z) 3. أحرف خاصة (على سبيل المثال، !a#S%^&)
الرجاء إدخال المعلومات بالتنسيق الصحيح
يرجى تحديد خانة الاختيار للمتابعة
يرجى تحديد خانة الاختيار للمتابعة
Important Notice
STARTRADER does not accept any applications from Australian residents.
To comply with regulatory requirements, clicking the button will redirect you to the STARTRADER website operated by STARTRADER PRIME GLOBAL PTY LTD (ABN 65 156 005 668), an authorized Australian Financial Services Licence holder (AFSL no. 421210) regulated by the Australian Securities and Investments Commission.
CONTINUEImportant Notice for Residents of the United Arab Emirates
In alignment with local regulatory requirements, individuals residing in the United Arab Emirates are requested to proceed via our dedicated regional platform at startrader.ae, which is operated by STARTRADER Global Financial Consultation & Financial Analysis L.L.C.. This entity is licensed by the UAE Capital Market Authority (CMA) under License No. 20200000241, and is authorised to introduce financial services and promote financial products in the UAE.
Please click the "Continue" button below to be redirected.
CONTINUEخطأ! حاول مرة اخرى.

